Give each expense its own assumption.
Same-home core expense growth slowed to a median 2.2% in January–June 2026 versus the prior year. Taxes rose 3.0%, while insurance fell 7.2%. One blanket escalator misses the differences.
FRONTFOOT RESEARCH / 2027 EDITION
Know what costs. Understand what changes. Build a budget you can defend.
Operating expense benchmarks per home, 2027 cost-growth assumptions, 20-market rent and vacancy trends, and a companion Excel budget worksheet. Built for single-family rental and build-to-rent investors, operators and lenders.
Your PDF download should start automatically. We’re emailing you the guide link, too.
27-page PDF + Excel worksheet · No account required
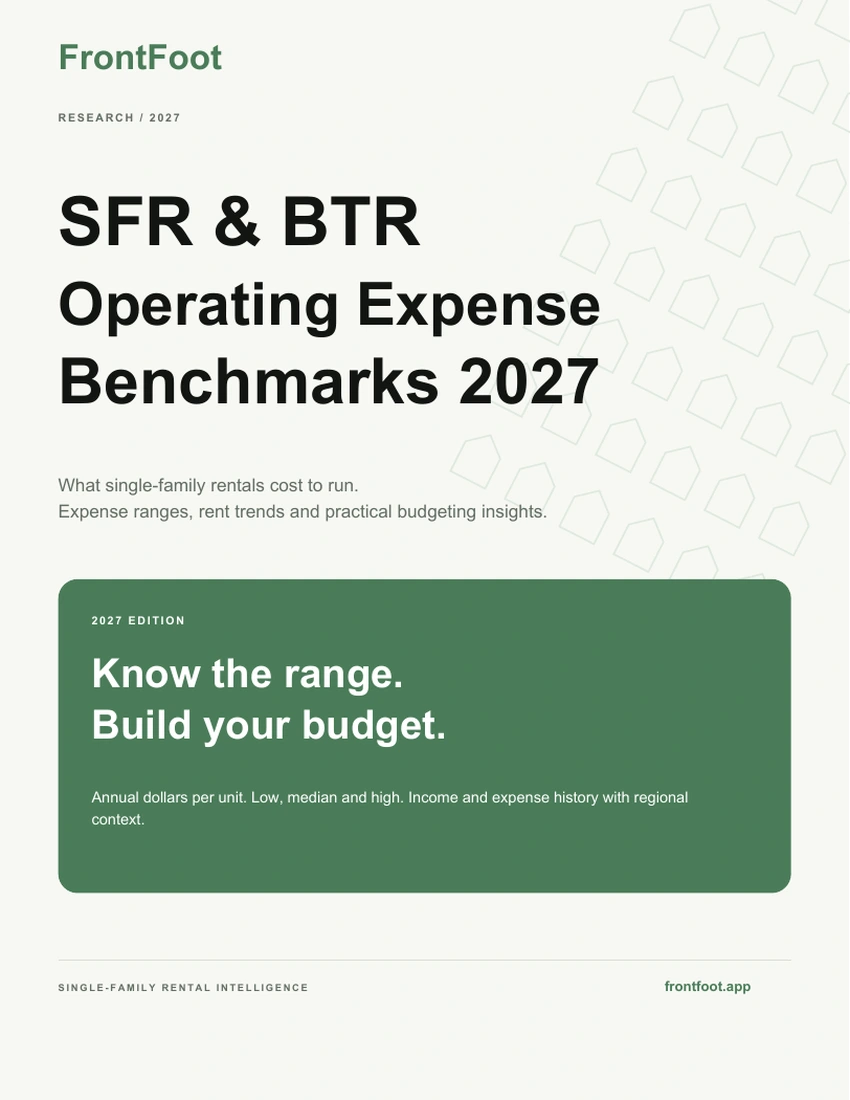 ANNUAL $/UNIT LOW · MEDIAN · HIGH
THE SETUP FOR 2027
Same-home core expense growth slowed to a median 2.2% in January–June 2026 versus the prior year. Taxes rose 3.0%, while insurance fell 7.2%. One blanket escalator misses the differences.
September FrontFoot Rent ranged from −4.5% (Phoenix) to +9.2% (Memphis) year over year across 20 rental markets. Budget new leases from local competition, and budget renewals, retention and collections separately.
Fees can lift revenue and still add little to NOI. Model the service costs, expected activity and complete management burden that sit behind each income and expense line.
Same-home growth compares matching homes and periods. FrontFoot Rent is an estimated market rent, not achieved lease growth.
INSIDE THE GUIDE
We analyzed securitization disclosures, issuer underwriting and public rental-portfolio operating results, then paired them with FrontFoot rent and vacancy data. Use it for your next acquisition, annual budget or portfolio review.
Taxes, insurance, HOA, maintenance, leasing and turns, management and total expenses.
Observed ranges over time, matched same-home expense growth and regional costs per home.
Rent trends, revenue, effective gross income, other-income examples and NOI.
The FrontFoot 2027 Budget Worksheet compares lower, base and higher cases side by side, with $/home, % of EGI and checks against the guide’s benchmarks.
A LOOK AT THE NUMBERS
The 2026 total operating expense median is $8,919 per covered unit annually, with observed values from $7,137 to $10,293. Use this as a historical reference, then build 2027 from the community’s actual cost drivers.
| Expense category | Low | Median | High |
|---|---|---|---|
| Property taxes | $3,588 | $4,125Range $3,588–$5,339 | $5,339 |
| Insurance | $224 | $368Range $224–$494 | $494 |
| HOA | $117 | $189Range $117–$437 | $437 |
| Repairs, maintenance & other | $803 | $1,002Range $803–$1,227 | $1,227 |
| Leasing, marketing & turnover | $700 | $760Range $700–$2,322 | $2,322 |
| Management | $1,433 | $1,479Range $1,433–$2,093 | $2,093 |
| Total operating expenses | $7,137 | $8,919Range $7,137–$10,293 | $10,293 |
Annual $/home, 2026. Each line is an independent benchmark, so the line medians don't sum to the total.
At the median, operating expenses absorb about a third of effective gross income (33.4% on matched statements; 2026 observations ranged from 33.2% to 42.1%). The guide shows both the dollars and the income burden for every line.
FRONTFOOT 2027 OUTLOOK
FrontFoot's base case calls for single-family rental operating expenses to rise 2.5–3.5% in 2027, with property taxes and maintenance outpacing insurance.
| 2027 planning assumption | Lower case | Base case | Higher case |
|---|---|---|---|
| Property taxes | 0–2% | 3–4%Lower 0–2% · Higher 5–8% | 5–8% |
| Insurance | −5% to 0% | 0–3%Lower −5% to 0% · Higher 5–10% | 5–10% |
| Recurring maintenance | 1–3% | 4–6%Lower 1–3% · Higher 7–10% | 7–10% |
| Leasing / turnover (per comparable package) | 0–2% | 2–4%Lower 0–2% · Higher 5–8% | 5–8% |
| HOA dues | 0–2% | 3–5%Lower 0–2% · Higher 6–8% | 6–8% |
| Management | Fee rate × EGI | Fee rate × EGI | Fee rate × EGI |
Same-home insurance costs fell 7.2% in January–June 2026, but higher insured values and liability costs can offset rate relief. Coastal Florida and Texas still need local quotes.
The median property tax per home has risen every year since 2023, reaching $4,125 in 2026. Budget from the assessment, not the average.
Same-home maintenance and turn costs rose 4.3% in January–June 2026, faster than core costs overall (2.2%).
Planning assumptions for stabilized communities with comparable homes and services, not observed percentiles. Known quotes, dues and tax bills override them. Build total growth from your own cost weights; budget turnover volume separately.
Run all three cases on your own budget with the Excel worksheet ↓FRONTFOOT RENT & VACANCY / SEPTEMBER 2026
Across 20 selected rental markets, September 2026 FrontFoot Rent ranged from a 9.2% gain in Memphis to a 4.5% decline in Phoenix year over year.
FrontFoot Rent is an estimated monthly market rent per home, not achieved lease growth. Institutional listing share = active listings ÷ tracked institutional inventory; it is not physical vacancy.
FROM REFERENCE TO RESEARCH
Daily asking rents, rent comps and owner-by-owner portfolios. Put the homes competing for your next resident alongside your operating assumptions.
Explore rental intelligence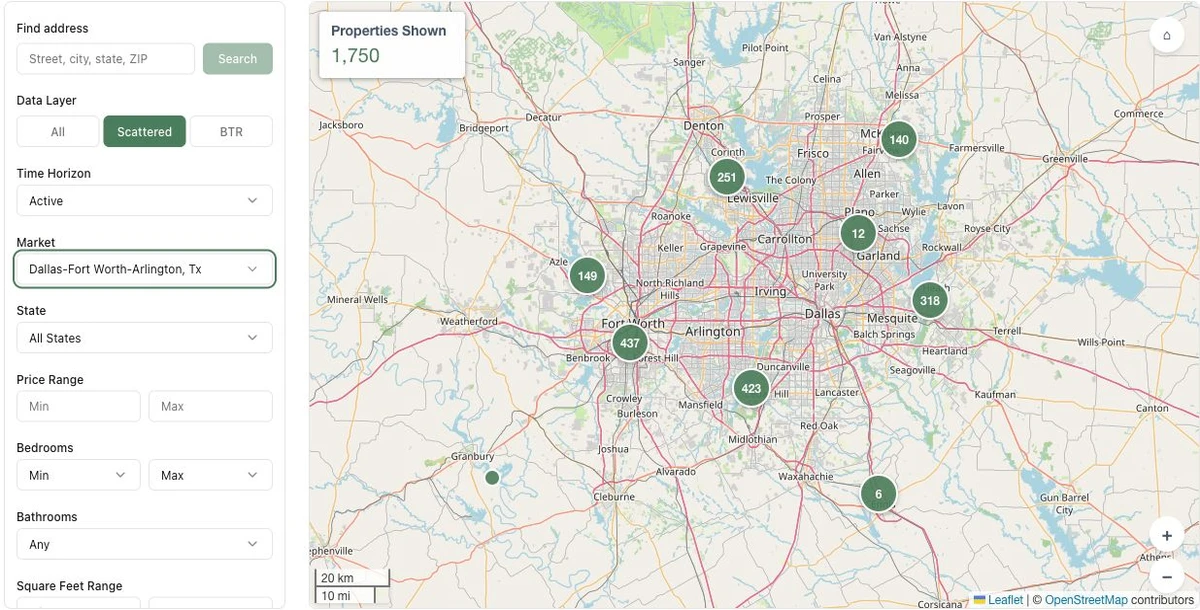
QUICK ANSWERS
A few useful distinctions to keep the reference working for you.
The 2026 portfolio-reporting median was $8,919 per home per year, with observations ranging from $7,137 to $10,293. Property taxes were the largest line at a $4,125 median, followed by management ($1,479), repairs, maintenance and other ($1,002), leasing and turnover ($760), insurance ($368) and HOA dues ($189). Capital spending, reserves and debt service are excluded.
Operating expenses absorb about a third of effective gross income at the median: 33.4% on matched 2026 statements, with observations from 33.2% to 42.1%. Start your budget in dollars per home, then divide by your own effective gross income to test the burden.
The 2026 median was $4,125 per home per year, with a range of $3,588 to $5,339, or about 17.7% of effective gross income at the matched-statement median. The dollar median has risen every year since 2023. FrontFoot’s 2027 base case assumes taxes rise 3–4%; known assessments and reassessments override that allowance.
The 2026 median was $368 per home per year, with an observed range of $224–$494. Same-home insurance costs fell 7.2% in January–June 2026, and FrontFoot’s 2027 base case assumes 0–3% growth in total insurance cost. Coastal Florida and Texas portfolios should budget from local renewal quotes.
FrontFoot’s base case is 2.5–3.5% total operating-expense growth for stabilized communities. Category assumptions are taxes 3–4%, insurance 0–3%, recurring maintenance 4–6%, comparable turn-package cost 2–4% and HOA dues 3–5%, with management following effective gross income. Build the total from your own cost lines and budget turnover volume separately.
The $8,919 annual operating-cost median combines SFR and BTR portfolio reporting. Apply the guide to the community’s design, including common areas, landscaping, amenities, warranties and owner-paid utilities. It is a combined reference rather than a separate BTR cost distribution.
Portfolio reporting across nearly 300,000 rental homes informs the research. FrontFoot analyzed securitization disclosures, issuer underwriting and public rental-portfolio operating results, with expense history from 2020 to 2026. Rent and vacancy trends come from FrontFoot market data. Data cut-off: November 2, 2026.
Yes. Enter your email to get the 27-page PDF and Excel budget worksheet immediately. No account is required, and future research emails are a separate opt-in.
LESS DIGGING. BETTER ASSUMPTIONS.
Make the next plan your best-informed one yet.
2027 edition · 27-page PDF + Excel budget worksheet